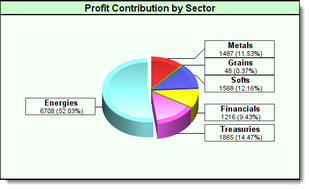
NewPie
Creates a sectioned Pie chart that can show legends, and pie section values connected to each segment of the pie chart.
Notes:
Do not use the SetPlotArea function with PIE charts because they don't support adjustable overlays.
Syntax: |
|---|
Chart.NewPie( ChartTitle, xAxisWidth, yAxisHeight, _ AsSeries(pieChartValues), AsSeries(pieLabels), PieSections, [Option] ) |
Parameter: |
Description: |
|---|---|
ChartTitle |
String variable. Name to display in pie chart's title bar area. |
xAxisWidth |
Horizontal pixel external width of chart. |
yAxisHeight |
Vertical pixel external height of chart. |
pieChartValues |
BPV numeric series of pie section value. |
pieLabels |
BPV String series of pie section names.
Note: Use with all BPV Numeric or String series that are passed to any Chart parameter.
AsSeries(...) function conditions the series so the chart function will be able to use the information contained within each of the series elements. |
PieSections |
pieChartValue sectopm and pieLabels series. |
[Option] |
Option create an upper left corner light source shadow behind the lower right area of the pie chart image so that is it appears to stand above the background area. |
Example: |
|---|
' ~~~~~~~~~~~~~~~~~~~~~~~~~~~~~~~~~~~~~~~~~~~~~~~~~~~~~~~~~~~~~~
|
Returns: |
|---|
|
Shadow styling around image was added later by graphics editing program |
Links: |
|---|
See Also: |
Edit Time: 9/7/2020 2:47:20 PM |
Topic ID#: 433 |

