Chart

Contents
Custom Charts:
At the end of a Simulation Test, it is possible to have various custom data graphs display test information on chart not possible previously. These new charts are created when Trading Blox Builder Basic Keyword statements are scripted to create one or more custom charts.
Custom chart can be directed appear in the Trading Blox Builder Summary Performance Reports, or as individual images in the user's default browser. Custom Chart images are in addition to the standard BPV Custom Graph images. These new Custom Charts can create new chart types shown here:
Pie
|
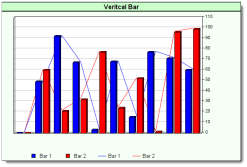
Columns with Lines
|
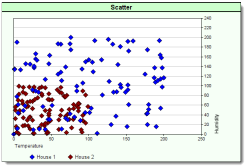
Scatter
|
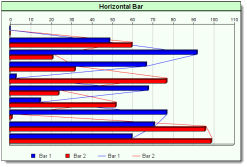
Bars with Lines
|
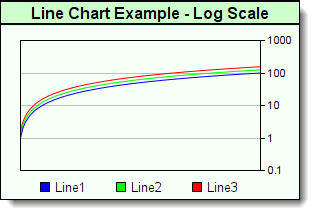
Lines - Linear Scale
|
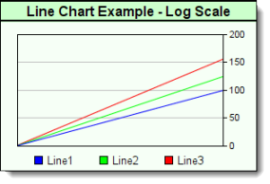
Lines - Log Scale
|
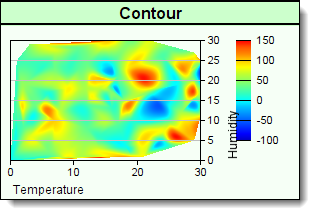
Contour - Smooth Map
|
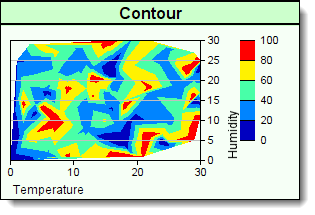
Contour - without Smooth Map
|

New custom charts provide users with an ability to analyze trading ideas with new visual data displays by collecting and displaying results in new ways.
These new chart types are intended to expand the ways that Trading Blox Basic can display test results as independent images, or as an expanded level of information at end of simulation test. All the needed new functions and properties needed to create, store and include the custom charts in an expanded report, or in a browser display can be found in the topics of the Chart Object subordinate pages.
Chart Creation:
Programming new charts starts with the process of deciding which of the six new chart types will be used.
Five of the new chart use the same basic creation function NewXY, but Pie charts require the NewPie function designed specifically for Pie charts to start the custom chart process.
Once the chart type, name and image size dimensions have been created, other functions can be added to change from a standard chart display to a more tailor image by apply control over the plotted area size and location, adding overlays that change how a chart appears, and then adding data.
When all the chart creation scripts have been executed, the Make function is executed so that it creates a file image that can be accessed and loaded into a summary report or a browser page.
When a custom chart is directed to appear in the Trading Blox Summary Performance Report, it will be placed in the area below the Custom Graphs section. If the custom chart is intended to provide information after a stepped simulation test, it will appear just below the stepped optimization table and chart area of a Summary Performance Report.
Charts can also be directed to automatically appear as an images displayed by browsers, or by the user imported the chart image into documents. Regardless of where the new custom chart is directed to appear, the chart images are files that can preserved in any folder named in the chart creation scripting process.
Chart Creation Step:
Custom charts only need a few simple steps to create a chart:
•Collect and analyze the data into BPV numeric series, and BPV String series if labels are needed.
•Determine the size of the chart, and then execute either the NewXY or NewPie functions to create chart image space .
•Adjust the plotting area within the chart image so the data plots, scales, labels and legends will all display properly.
•Add all the data series needed for plotting, and then decide if dates, axis labels are needed to improve chart information.
•Make the chart into a finished image by executing the Make function that directs the file to active report folder.
•Create the simple HTML image display code when images are to be displayed in a browser, or displayed in a performance report.
Custom Chart Requirement:
Before charts can be displayed, they must be saved as an image file so they can be accessed and displayed in performance reports or browsers.
Creating an image file is made easy with the Make function that must be present at the end of all chart script sections.
Once the file is saved, it can be displayed when the Trading Blox Builder Preference setting is enabled:

Preference settings to enable Custom Graphs and Custom Charts.
Display Custom Charts in a Simulation Report:
Images in the simulation report use a default width of 830 pixels. By using that width, or a smaller value the report's display width will be preserved.
Custom chart images displays in the summary performance report are supported by two new test-object functions. Each function places custom charts in different locations to support where the charts can be found.
Display custom charts in the area at the bottom of where BPV custom graphs are displayed:
|
Display charts just below Multi-Parameter Table in the Stepped Parameter Summary Performance table:
Example - BEFORE TEST SCRIPT: |
|---|
' ============================================================== OR ' ============================================================== ' side by side. OR ' ============================================================== ' the second image: ' one above the other. |
Display Custom Charts in default browser:
Usually, the default program is the computer's default browser. Place this code section below the area where the custom chart script creation has saved the chart using the chart.Make function
Example - AFTER TEST SCRIPT: |
|---|
' ~~~~~~~~~~~~~~~~~~~~~~~~~~~~~~~~~~~~~~~~~~~~~~~~~~~~~~~~~~~~~~ |
Links: |
|---|
CHARTNOVALUE Make, NewPie, NewXY, OpenFile, SetChartSimulationHtml, SetChartTestHtml |
See Also: |
Edit Time: 9/13/2020 3:46:53 PM |
Topic ID#: 191 |