SetxAxisDates
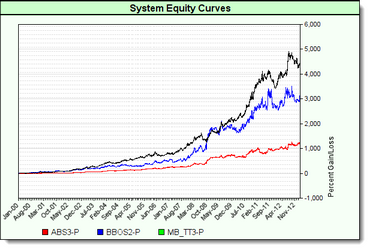
Function changes the numbered X-Axis scale labels to Dates at the major tick-mark locations. Date range displayed on the chart will cover the entire date range between the simulation Test-Start date and Test-End date.
Notes:
Controlling the stepping of dates is highly dependent upon the amount of area available to display dates.
If using a custom date series, convert each element to ChartTime. As an example, in the After Trading Day script: DateSeries = chartTime( test.currentdate, test.currentTime )
To use the internal default date/time chartTime series, pass in 0 as the date series. Further parameters can still be used for formatting and such.
Syntax: |
|---|
chart.SetxAxisDates( AsSeries(DateSeries), [ElementCount], [Filter], [LabelStep], [Format]) |
Parameter: |
Description: |
||||||||||||||
|---|---|---|---|---|---|---|---|---|---|---|---|---|---|---|---|
DateSeries |
The numeric date series, converted using ChartTime. Or if 0 is passed in, the default internal test date/time will be used.
Note: Use with all BPV Numeric or String series that are passed to any Chart parameter.
AsSeries(...) function conditions the series so the chart function will be able to use the information contained within each of the series elements. |
||||||||||||||
[ElementCount] |
The number of elements in the date series. |
||||||||||||||
[Filter] |
Option is dependent upon date data in the supplied series, and chart axis display area.
|
||||||||||||||
[LabelStep] |
The default is zero, or one, and it will show all the axis labels the scale area allows. A values of 2 will hide two months of a quarter, a value of 6 shows a date label every 6-months. |
||||||||||||||
[Format] |
"{value|mmm-yy}" |
Example: |
|---|
' ~~~~~~~~~~~~~~~~~~~~~~~~~~~~~~~~~~~~~~~~~~~~~~~~~~~~~~~~~~~~~~ |
Links: |
|---|
See Also: |
Edit Time: 9/7/2020 2:52:23 PM |
Topic ID#: 565 |

