SetBarGapShape

Contents
Function must be used with the AddBarLayer function and it must only be executed after the AddBarLayer has executed.
When used this function can change the shape of the bar, and optionally it can the gap between bars, and as an additional option it can change the space between bar groups.
NOTE:
A Gap is the space between each bar value of the same series. Subgap spacing is the distance between the bars of different series, which is also of a different color. For multi-bar layers (bar layers using the Side data combine method, or for stacked bar layers with multiple data groups), Gap refers to the portion of the space between bar groups, while SubGap refers to the portion of the space between bars within the same bar group.
Syntax: |
|---|
chart.SetBarGapShape( [Shape], [Gap], [Subgap] ) |
Parameter: |
Description: |
||||||||||||||||
|---|---|---|---|---|---|---|---|---|---|---|---|---|---|---|---|---|---|
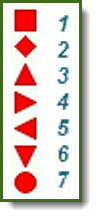
[Shape]
|
|
||||||||||||||||
[Gap] |
Sets the gap between the bars in a bar chart layer.
Gap between the bars is expressed as the portion of the space between the bars. For example, a bar gap of 0.2 means 20% of the distance between two adjacent bars is the gap between the bars.
The portion of the space between the bars, or between bar groups for multi-bar layers, uses a default bar gap = 0.2 or 20% |
||||||||||||||||
[Subgap] |
This argument only applies to multi-bar charts. It is the portion of the space between the bars in a bar group. Gap uses the same decimal process to represent the size of the Subgap spacing between groups |
Example: |
|---|
' ~~~~~~~~~~~~~~~~~~~~~~~~~~~~~~~~~~~~~~~~~~~~~~~~~~~~~~~~~~~~~~
|
Returns: |
|---|
This Image is a collection of column chart images showing the various shapes. It also shows the Gap and Subgap locations where their size changes the bar spacing:  Bar Shapes & Gap Space References |
Links: |
|---|
AddBarLayer, AddBarSeries, AsSeries, Make, NewXY, ResultsReportPath, SetPlotArea |
See Also: |
Edit Time: 9/7/2020 2:50:07 PM |
Topic ID#: 534 |