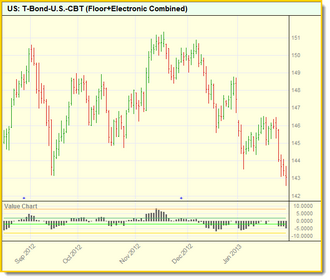
ValueChart
Volatility adjusted overbought/oversold oscillator. Value chart levels between -4 and +4 are considered “fair value”; +4 to +8 moderately overbought; -4 to -8 moderately oversold. Levels above +8 are considered significantly overbought and below -8 significantly oversold.
Value Charts are discussed in the book “Dynamic Trading Indicators” by Mark W. Helweg & David C. Stendahl.
Syntax: |
|---|
ValueChart ( series, bars ) |
Parameter: |
Description: |
|---|---|
series |
Name of the series. The series must be one of Instrument.High, Instrument.Low, Instrument.Close, Instrument.Open. |
bars |
The number of bars over which to find the value chart level. |
Notes:
In copyright publication dated 2002 Value Charts are described on page 127 to 145.
Book uses the value of the Value Chart return to decide if a bar on the chart qualifies for a signal.
Returns: |
|---|
The value chart level over the specified number of bars. |
Example: |
|---|
' ~~~~~~~~~~~~~~~~~~~~~~~~~~~~~~~~~~~~~~~~~~~~~~~~~~~~~~~~~~~~~~
|
Chart Display: |
Links: |
|---|
See Also: |
|---|
Edit Time: 9/26/2020 1:32:55 PM |
Topic ID#: 644 |

